February 4, 2021
Daily Market Analysis
Market Focus
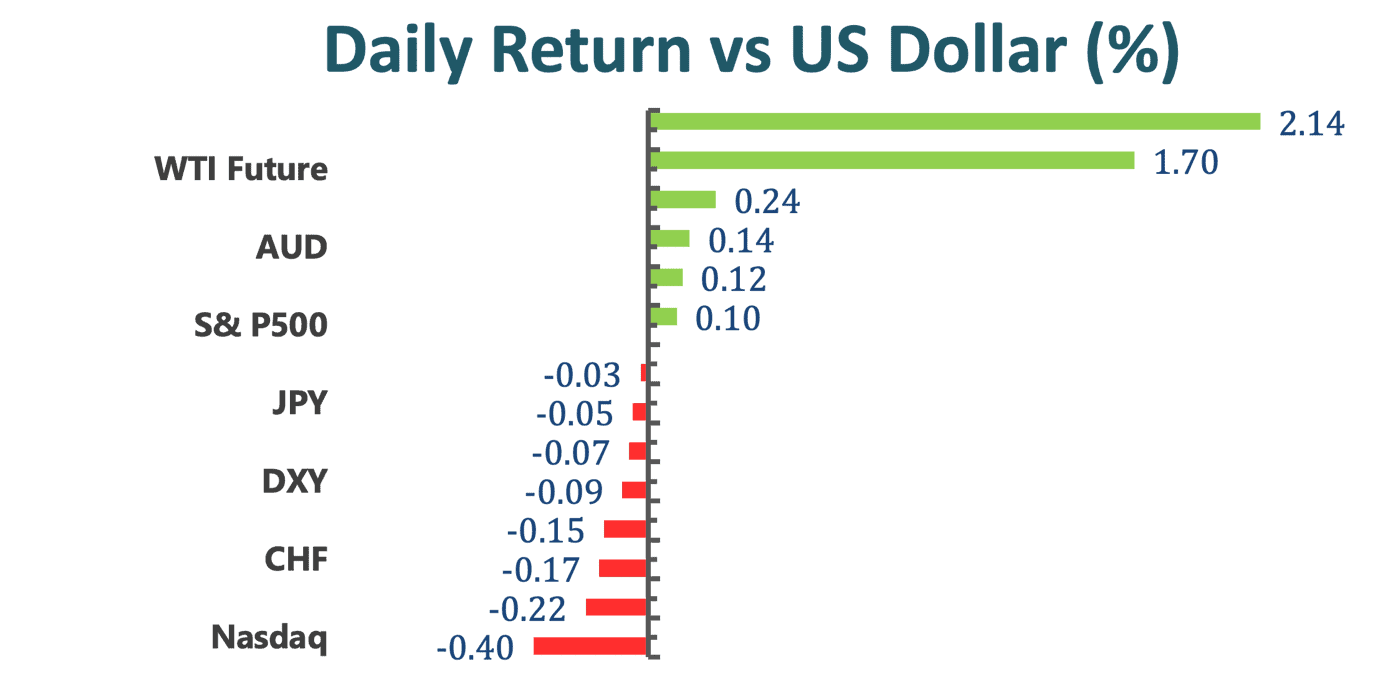
Stocks almost wiped out their advance as a drop in technology and retail shares dragged down the Nasdaq 100. Treasuries retreated. Oil climbed. The S&P500 closed with a small gain following its biggest two-day rally in almost three months. Energy and financial shares outpaced tech even after Google’s parent Alphabet Inc. hit a record on stellar results, while Amazon.com Inc. slumped. Banks climbed as JPMorgan Chase & Co. and Morgan Stanley issued bullish calls on the industry. GameStop Corp., the poster child for Redditors looking to squeeze short sellers, and movie-theater chain AMC Entertainment Holdings Inc. rebounded following Tuesday’s plunge. Drug-maker Biogen Inc. slumped after disappointing forecasts.
A widely watched segment of the Treasury yield curve reached its steepest level in almost five years even as the U.S. decided not to increase auction sizes for long-maturity notes and bonds at next week’s quarterly refunding sales. Data showed companies added more jobs than forecast in Jan, while growth at service providers accelerated.
According to Mike Loewengart, the managing director of investment strategy at E*Trade Financial Corp, “There has been a ton of noise in the stock market these past few weeks, so it’s encouraging to see solid economic reads. There may be signs of overextension when it comes to single stocks, but under the surface there is an economy regaining serious momentum.”
Market Wrap

Main Pairs Movement
JPY net long positions had dropped after their recent push to the highest levels since October 2016 which is transpired in the spot market following a breakout of the long-term bearish dynamic resistance.
Demand for the greenback receded, leaving room for the aussie to recover some ground. At the time of writing, AUDUSD trades around 0.7625, looks to snap three-day losing streak.
USDCAD has for the most part stayed below the 1.2800 level on Wednesday, with resistance in the form of the 50-Day moving average at 1.27967 also helping to keep the price action under wraps. Right now, USDCAD is trading in the 1.2760s and eyeing a test of Tuesday lows.
The US Dollar Index, which tracks the greenbaack vs. a bundle of its main competitors, recedes to the 90.15/10 band following earlier 2021 tops aorund 90.30.
WTI surged for a third straight day on Wednesday, rallying from around the $55.00 mark during early European trading hours to as high as the $56.30s in wake of the 14:00GMT crude oil pit open.
Technical Analysis:
EURUSD (Four-hour Chart)

EURUSD continues to dip low on Wednesday amid stronger greenback and better-than-expected US ISM PMI data. In the beginning of the day, the EURUSD traded in a tight range between 1.2050 and 1.2036, but tumbled to the daily low near the psychological support at 1.2000 in the American session. The renewed bearish pressure is largely initiated by the increasing demand for the greenback as the upbeat data published by Eurostat earlier in the day is mostly ignored by the market. From a technical perspective, the 60-Day SMAVG is supporting the current bearish trend of the Fiber. However, as both the RSI is approaching the 30-threshold and the price of EURUSD is closing near the 1.2000 support, it is inferable that a positive correction may be staged in the near future. On Thursday, Retail Sales data from the eurozone and US Initial Jobless Claims are closely monitored.
Resistance: 1.2049, 1.2093, 1.2131
Support: 1.2014, 1.1960, 1.1925.
GBPUSD (Four-hour Chart)

The Cable pair is trading modestly lower on the day after temporarily touching the high of 1.3684 in the early Euro session. The pullback of the GBPUSD was largely due to the two-consecutive day winning DXY, however, despite the better-than-expected US ISM and ADP data, the DXY did not seem to react much to those numbers. This is possibly because the UK data in the service sector is also indicating a strong, resilience comeback. On top of that, since the expected rate cut from the BoE is lifted, the pound is perceived to be relatively strong amid the strengthened greenback. Upcoming post-Brexit meeting are eyed. Technically speaking, the Cable is under a downward momentum, and would likely to remain bearish as the 40ish RSI indicates there are still room for the pair to move lower.
Resistance: 1.3681, 1.3711, 1.3761
Support: 1.3636, 1.3608, 1.3554
XAUUSD (Four-hour Chart)

For the second day in a row, the XAUUSD continues to struggle to find a direction between the close range within $1833 and $1842. Although U.S. President Biden is pushing to go big on the next stimulus package, but his decision only incentivizes a sell-off in bonds and does not help to boost the pricing of Gold. From a technical perspective, the XAUUSD remains under pressure as the 60-Day SMAVG is currently fluctuating above the 20-Day SMAVG. Additionally, if the XAUUSD is able to break below the multiply tested support at $1829, the RSI reading suggests the precious metal would dip further. On the flip side, if the XAUUSD reverses its downward trending pattern, the first resistance can be seen at $1842, then $1858, followed by $1875.
Resistance: 1842, 1858, 1875
Support: 1829, 1818, 1805
Economic Data
|
Currency
|
Data
|
Time (TP)
|
Forecast
|
|
GBP
|
Construction PMI (Jan)
|
17.30
|
52.9
|
|
GBP
|
BoE Interest Rate Decision (Feb)
|
20.00
|
0.10%
|
|
USD
|
Initial Jobless Claims
|
21.30
|
830K
|
|
|
|
|
|
|
|
|
|
|
|
|
|
|
|
|
|
|
|
|
|
|
|
|
|
|
|
|
|
|
|
|
|
|
|
|
|
|
|
|


